Human Population, Land Use, and Residential Development Report
Download PDF (21 MB)
Methow Conservancy, 2026
The Methow Population and Land (PAL) Project is a sub-component of the State of the Methow Project. The PAL project is a series of reports and webpages that include information on the current conditions and trends in human population, land use, development, and land protection in the Methow Valley. The project is a “living” project, and data and associated reports will be updated every 5 years, with select key parameters updated annually on this website. The project includes a written report, Human Population, Land Use, and Residential Development Report, that is also available to the public.
In this section:
The total population (including both full-time and part-time residents) in the Methow Watershed is increasing, with about a 14 percent increase over the past five years (2020-2025) and an almost 50 percent increase over the past 20 years (2005-2025). The most-recent five-year period and the 2005-2010 five-year period saw the highest rates of growth.
Full-time and Part-time Population
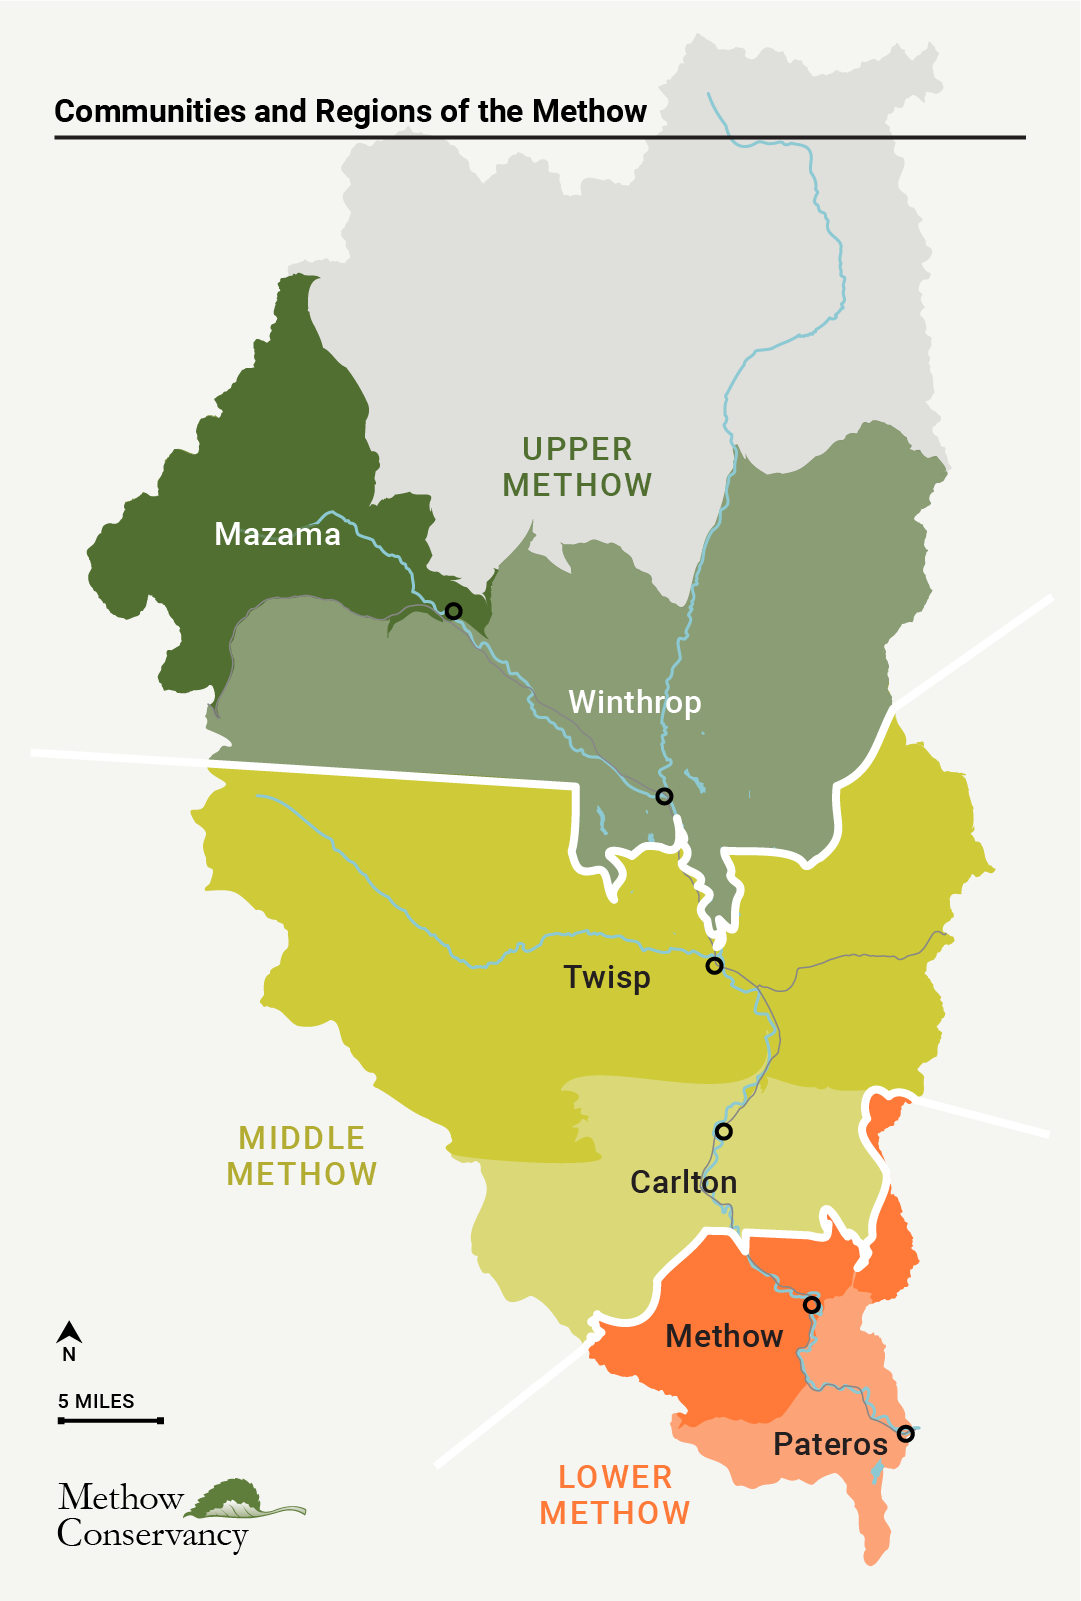
The percent of residents who are full-time has remained quite stable over time and is lower for communities in the Upper Valley than other areas.
Percent Full-time Residents
Full-time and Part-time Residents, 2025
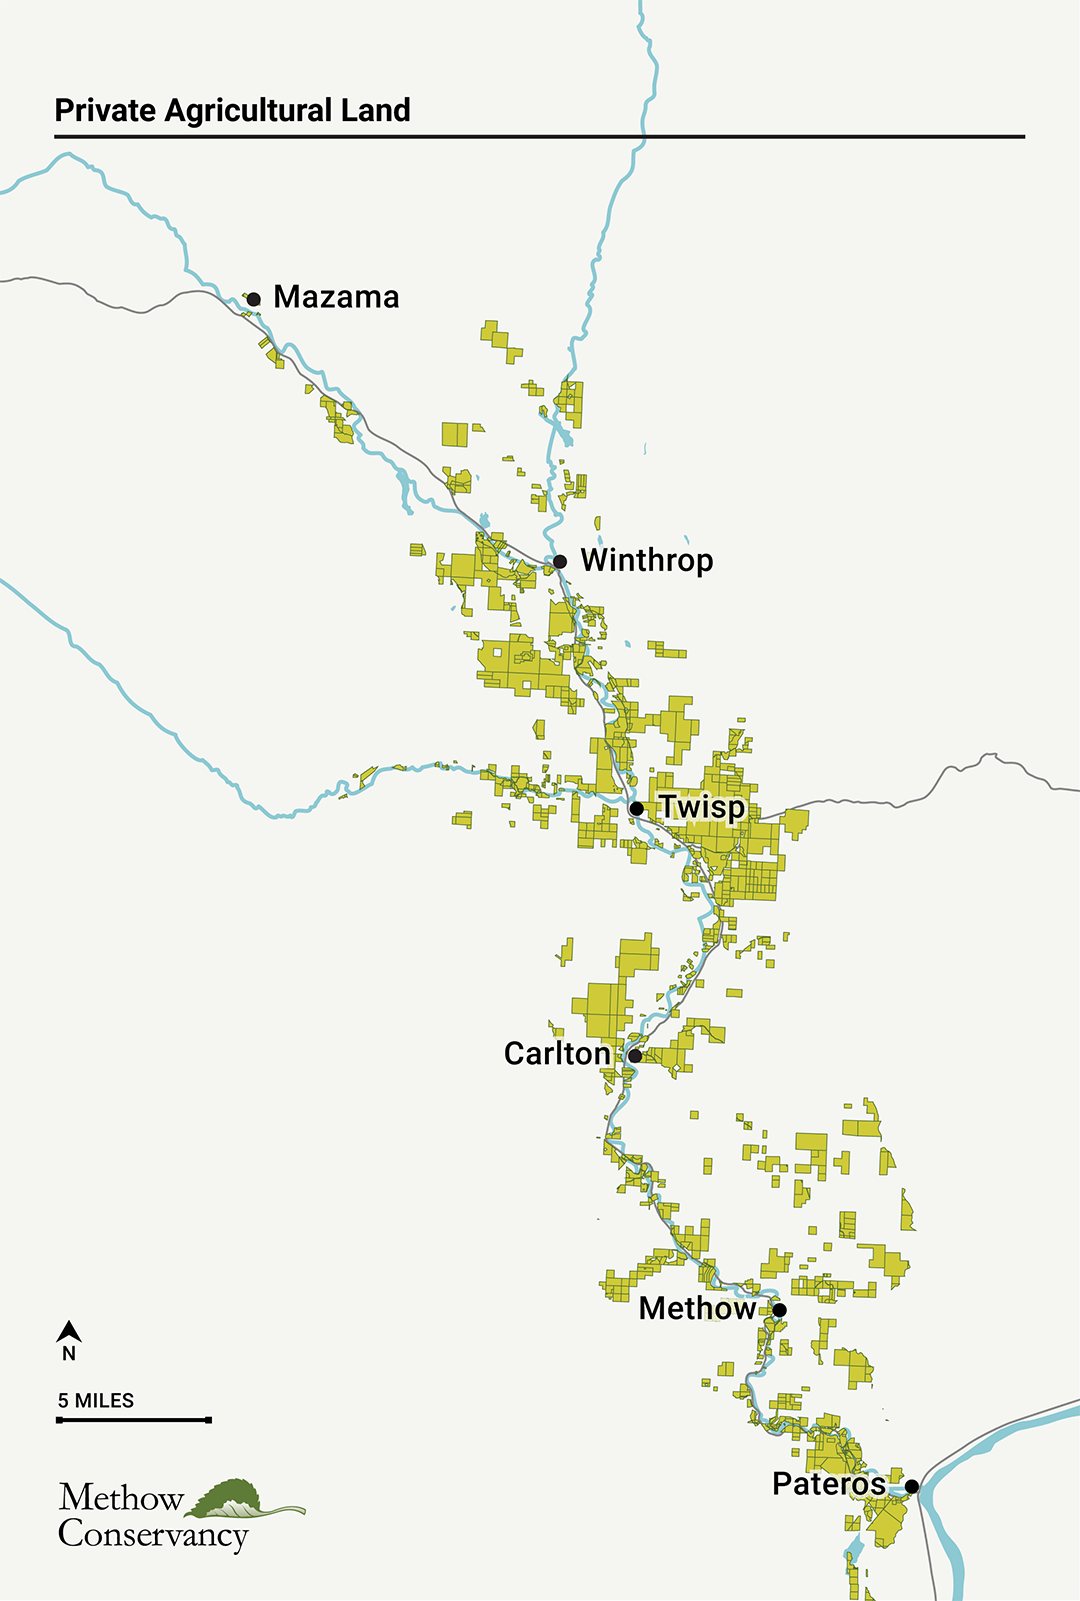
Of private land acreage, about 45 percent is in agricultural parcels, 28 percent is in residential parcels, and 25 percent remains undeveloped (and the remaining 2 percent is in other land use types).
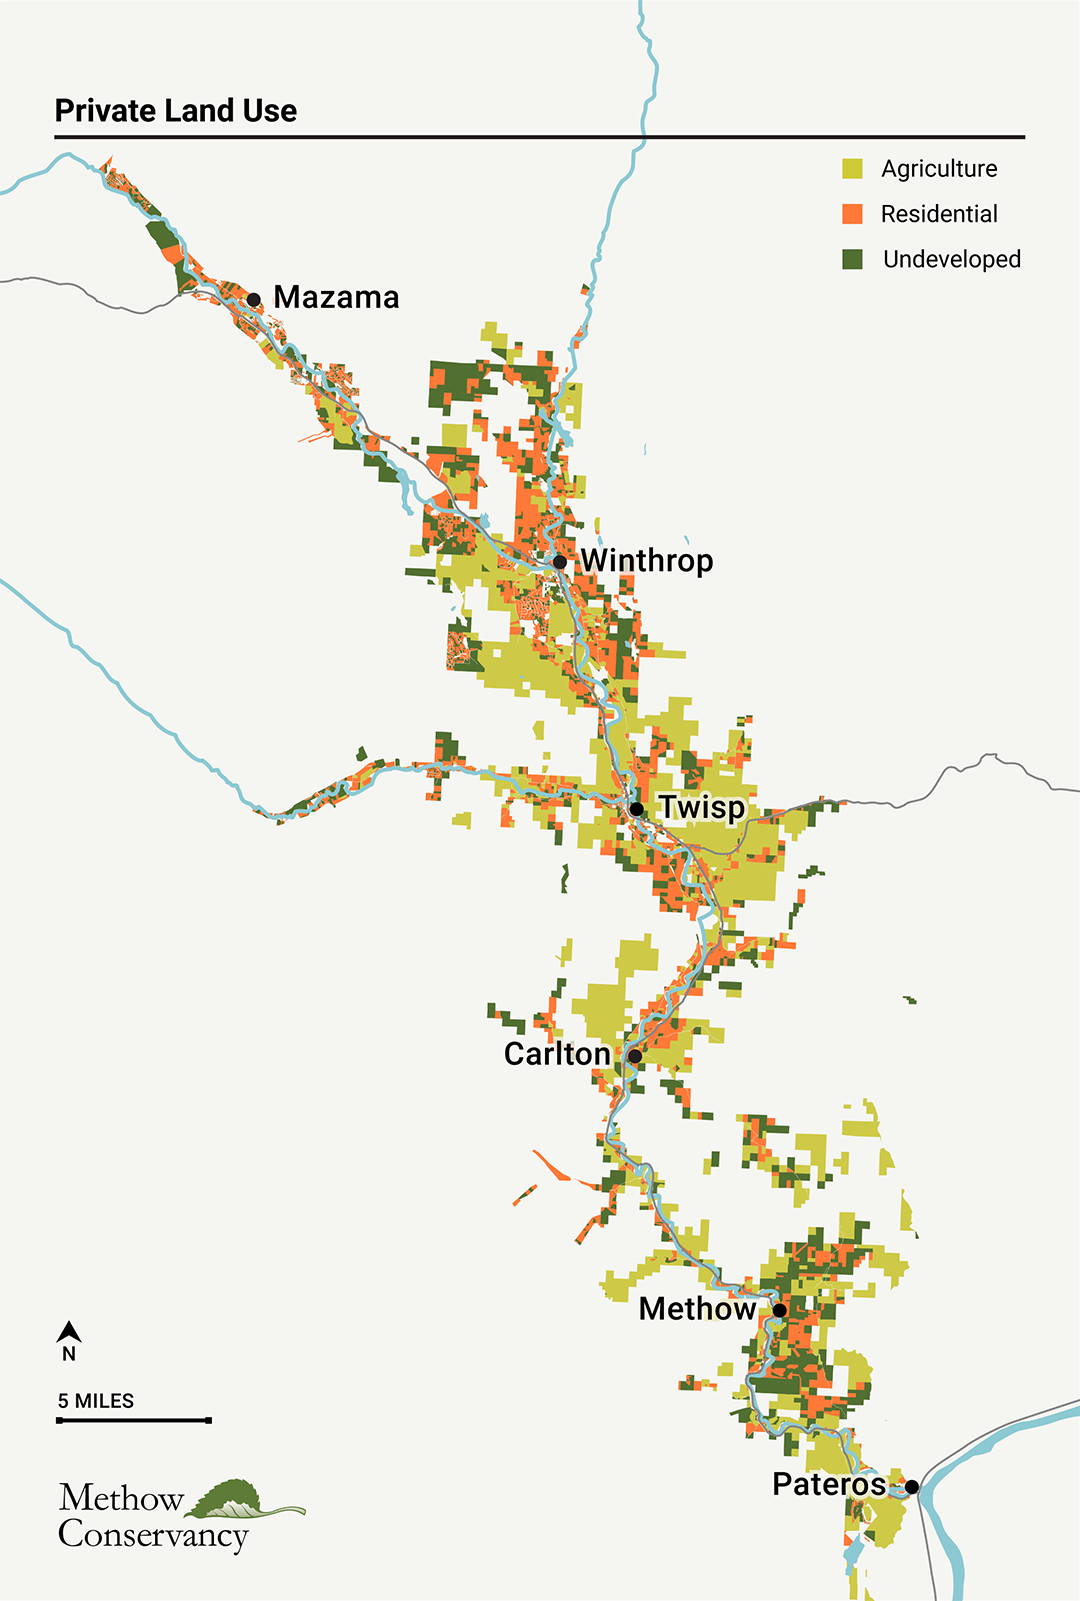
From 2020-2025, 5.8 percent (~2,200 acres) of agricultural private land was converted to other uses or was purchased by WDFW (~520 acres). Similar trends are evident over the 20-year period from 2005-2025, with agricultural private land acreage declining by 22 percent, undeveloped land acreage increasing by about 12 percent and residential land acreage increasing by 43 percent during this time period. Note that acreages are based on the single land use type that the county assigns to the entirety of a given parcel.
Land Use Category Over Time
Private Agricultural Acres, 2005-2025
The majority of private parcels are less than 5 acres in size.
Parcels by Size Class as Percent of Total Number of Private Land Parcels, 2025
While parcels at least 100 acres in size represent only one percent of the total number of private parcels, when we look at total private land acreage, these large parcels comprise almost one-quarter of the total acreage.
Parcels by Size Class as Percent of Total Private Land Acres, 2025
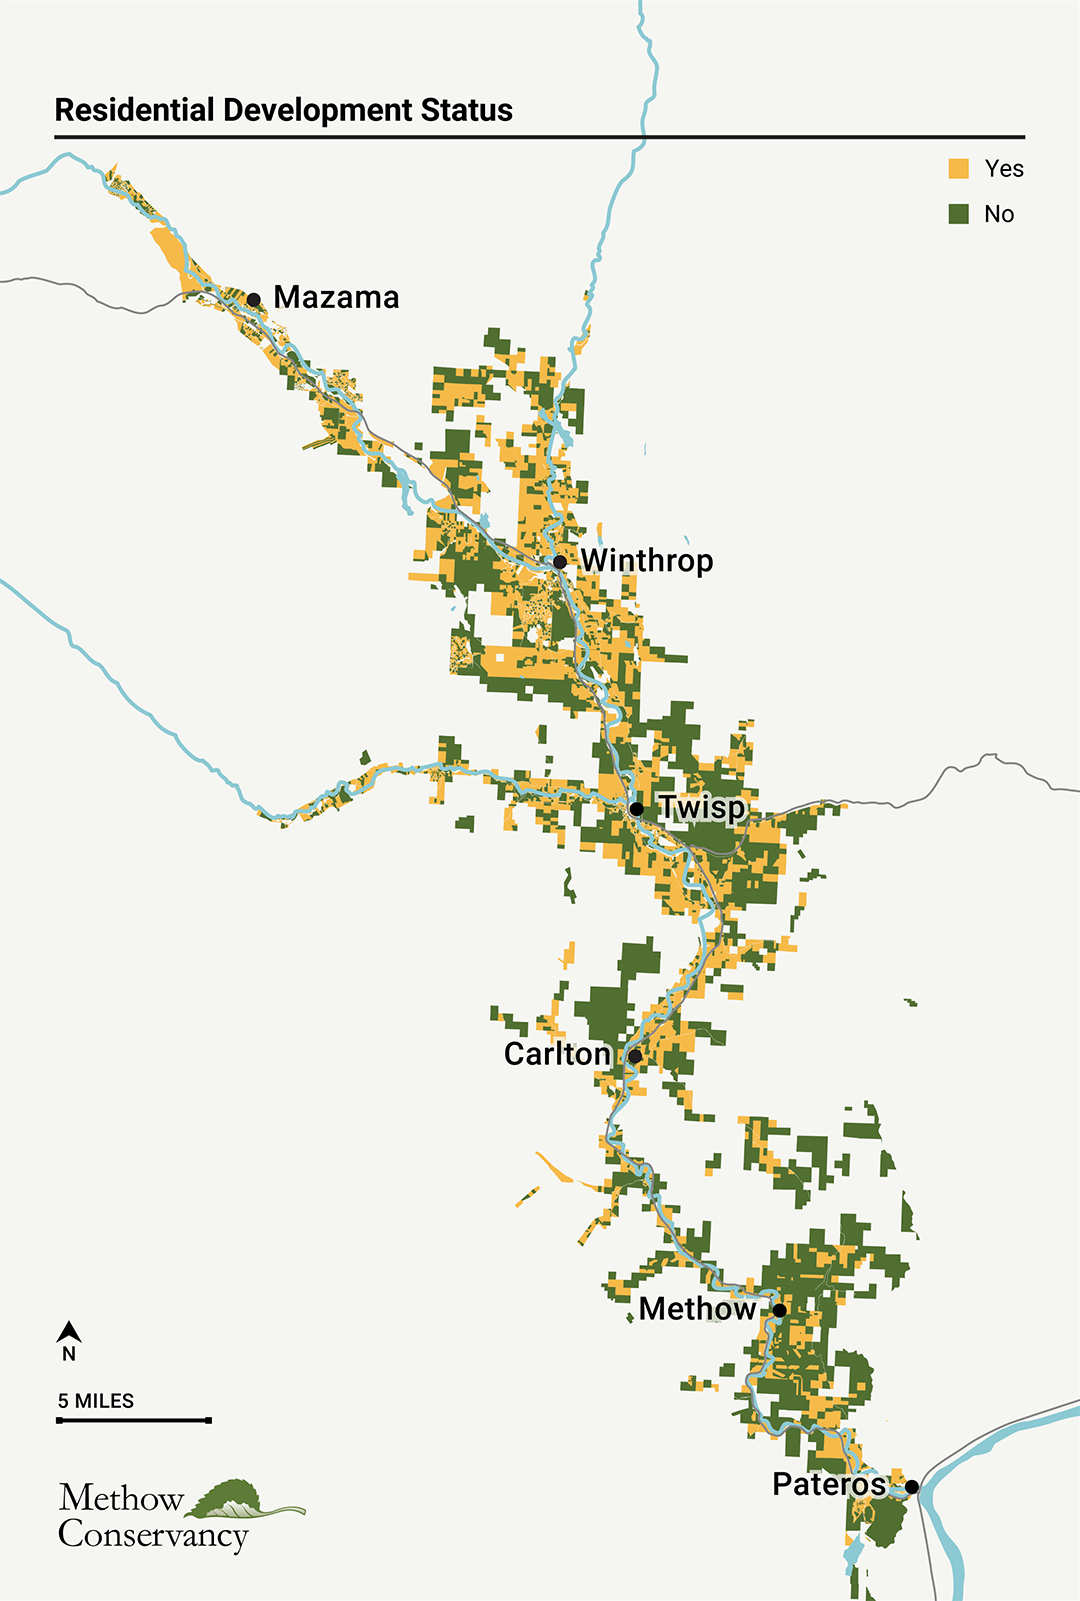
The percent of private parcels that are developed is higher for the Upper and Middle Methow than the Lower Methow as of 2025.
Private Parcel Development Status by Community
The number of developed residential parcels increased by about 53 percent from 2005-2025, with a relatively high rate of development in the past 5 years (almost 15 percent for 2020-2025).
From 2005-2025 an average of 80 building permits for new residential structures were issued per year, with building concentrated in the Upper Valley. The annual number of permits issued has been has been relatively stable since 2013, with a peak in the 2020-21 time period (as influenced by the COVID epidemic and the desire of people to build homes in mountain towns in the West.) Since the creation of the Methow Housing Trust in 2012, approximately 10 percent of the building permits issued for single family residences have been for affordable housing units. In addition, three permits for affordable apartments (through the Okanogan Housing Authority) were issued in 2025.
Building Permits by Community
About 17 percent of private land acreage in the Methow Watershed has been protected (through conservation easements or purchase by non-profit conservation organizations), with percent protected being greatest for the Upper Methow.
Protected Acres of Private Land, 2025
26 percent of private agricultural land has been protected (through conservation easements or fee-simple ownership) as of December 2025. Percent of agricultural land protected is greatest for the Upper Methow, but acres protected is greatest for the Middle Methow.
Protected Agricultural Acres, 2025
Download PDF (21 MB)
Methow Conservancy, 2026
Data compilation and analysis by Julie Grialou. Graphics and photography by Benjamin Drummond.
Last updated April 2026.